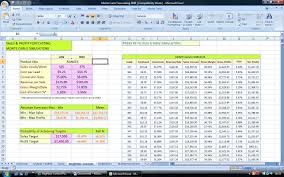
Financial Modeling in Excel
Microsoft Excel is the spreadsheet program most commonly used by financial analysts, project managers, academics, and small business owners around the world to track and analyze business and personal data. Because of the increasing demands on their time, business professionals need to learn efficient and effective data forecasting methods that give them the answers they need. This course will provide experienced Excel users with a practical, hands-on understanding of advanced Excel data forecasting and charting techniques. It examines the risks and benefits of forecasting, teaches different forecasting and trending methods, and explores ways to maximize profit potential.
Objectives:
After completing this course, students will be able to:
- Describe the role data forecasting plays in organizational planning.
- Identify the positive and negative aspects of data forecasting.
- Create formula-based data forecasts.
- Define best, middle, and worst case scenario data.
- Establish target values using Goal Seek.
- Calculate moving averages.
- Chart moving averages interactively.
- Calculate Net Present Value and Internal Rate of Return.
- Define and solve problems in Solver.
Who should attend?
This course is designed for Microsoft Excel users, including project managers, financial analysts, accountants, business owners, and other business professionals who have a vested interest in forecasting trends at the corporate levels. This audience uses Excel on a regular basis and has no difficulty creating formulas, charts, and cell formats.
Course Outline:
The course will address:
- Writing formulas 25
- Copying / cutting and pasting formulae 36
- Paste special 53
- Inserting functions 62
- Tracing cell references & debugging formula errors 77
- Loan repayments 90
- Discount cash flows 103
- Securities functions 121
- Functions for basic statistics 152
- Other mathematics & statistics functions 172
- Logical & information functions 190
- “ smart “ nested function that respond to formula result
- Enhancing excel 220
- The solver tool for constrained linear optimization 227
- “ if – then “ analysis scenarios and goal seek 236
WORKSHOP STYLE:
A mixture of short presentations, interactive discussion, individual exercises and group work. The emphasis throughout is on a practical approach using case material and examples.